FOR TRADERS WHO WANT MORE FROM THEIR AGENATRADER MARKET ANALYSIS

See more of the market. With the right indicators.

Not every trading idea needs a comprehensive strategy platform. Sometimes you simply need another piece of information on your chart or in your scanner: unusual volume, volatility, momentum or important price levels.

The ThinkAndTrade Indicator Club brings together seven specialized tools for AgenaTrader. Use them individually or as a bundle to add the market context that matters to your analysis.

  • Put market activity into context - with Dollar Volume and Volume Buzz
  • Compare volatility - with ADR Percentage, Sigma Spikes and VIX zones
  • See chart structure more clearly - with MACD Colored and Fractals

For AgenaTrader · 7 indicators · Individually or as a bundle

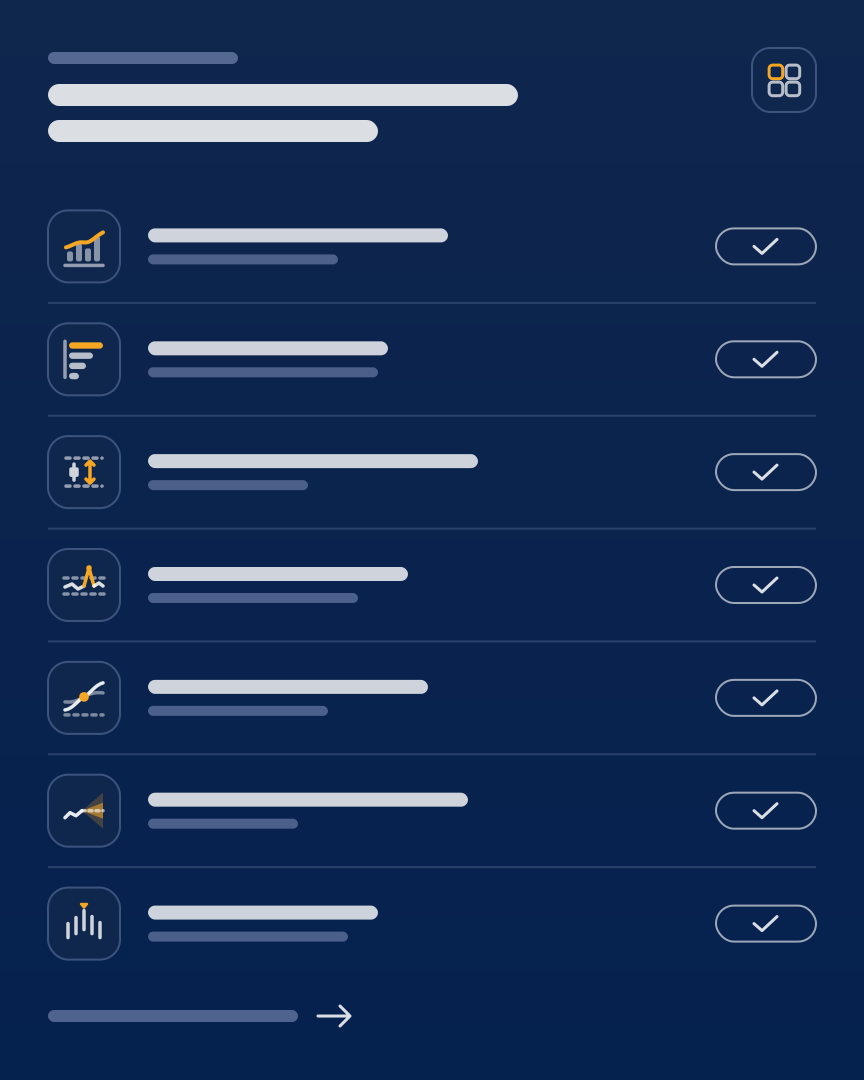
Indicator Club as a contents list: seven indicators with their symbols, each one ticked
Dejan, founder of ThinkAndTrade

About me

DejanFounder of ThinkAndTrade and former AgenaTrader employee

I worked at AgenaTrader for five years and have developed my own indicators and trading tools through ThinkAndTrade. Along the way, I also created smaller tools that answer specific questions during everyday market analysis.

I want to make these tools available through Indicator Club: not as a finished trading strategy, but as additional information you can use in a way that fits your own trading approach.

01 · THE CHALLENGE

Price tells part of the story. Context tells you more.

Price movements alone do not tell you whether trading volume is unusually high, how much an instrument typically moves or where significant price structures have formed. Without the right indicators, you have to piece together that information from separate tools.

Indicator Club adds focused analysis tools to your charts. Choose the indicators that fit your method, while keeping the interpretation and trading decisions in your own hands.

COMMON QUESTIONS IN MARKET ANALYSIS
  • Is trading volume unusually high? Absolute volume figures can be difficult to compare across instruments.
  • How far is this market moving? Volatility is harder to assess without a consistent basis for comparison.
  • Is momentum changing? Important shifts can be easy to miss in a standard chart view.
  • Where are significant price levels? Local highs, lows and price zones often have to be marked manually.
02 · HOW IT WORKS

Choose the tools that fit your analysis.

You do not need to use all seven indicators at once. Select the information that helps you assess a setup, depending on the market, timeframe and trading approach.

  1. Step 1

    Define your analysis goal

    Decide whether you want to examine volume, volatility, momentum or price structure.

  2. Step 2

    Choose your indicators

    Use individual tools or combine several perspectives in your AgenaTrader workspace.

  3. Step 3

    Review the market context

    Compare the displayed information with price action, trading hours and your own methodology.

  4. Step 4

    Apply your trading rules

    Use suitable indicator values in the scanner and conditions, then make your own decision about each setup.

One bundle, several ways to look at the market

Indicator Club is not a standalone trading system. Its seven indicators provide different types of information that you can use independently or in combination.

03 · FEATURES

Seven indicators. Six areas of analysis.

The two volume indicators share one card. All seven indicators offered on the current product page are listed by name.

  • Feature 01

    Dollar Volume & Volume Buzz

    Put trading activity into context using dollar volume and deviations from typical volume levels.

  • Feature 02

    ADR Percentage Plot

    Compare average daily trading ranges as percentages across instruments with different price levels.

  • Feature 03

    Sigma Spikes

    Spot unusual price moves relative to an instrument’s typical volatility.

  • Feature 04

    MACD Colored

    Assess momentum and how it changes with an enhanced, customizable MACD display.

  • Feature 05

    VIX Volatility Zones

    Use price zones derived from volatility data to add another perspective to your analysis.

  • Feature 06

    Fractals

    Highlight significant local highs and lows on the chart instead of marking them one at a time.

04 · GOOD TO KNOW

More ways to analyze the market, not a ready-made trading strategy.

Indicator Club adds specialized views to your analysis. Whether a setup is worth trading still depends on your strategy, market data and risk management.

Seven different analysis tools

Each indicator serves a different purpose. Together they are not intended to function as one automated trading system.

Volatility zones are not price forecasts

ADR, Sigma Spikes and VIX Volatility Zones provide statistical or volatility-related context. They cannot guarantee future prices or profits.

Fractals are identified from price data

A highlighted high or low is a reference point for analysis, not a reliable prediction of the next price movement.

Scanner and conditions

The product page confirms that indicator outputs can be used in scanners and custom strategies. Which values are useful depends on the indicator and its settings.

Overlap with the ADR AddOn

According to the product page, ADR Percentage Plot has been included in the ADR AddOn since version 1.5. Check whether you already own it before buying it separately.

Personal coaching is optional

Documentation, webinars, community access and support are offered. One-to-one coaching can be booked separately.

05 · CUSTOMER FEEDBACK

What traders say about Indicator Club.

  • [OPEN: name or initials]

    [OPEN: date]

    [OPEN: real customer quote about Indicator Club, with the customer’s consent]

  • [OPEN: name or initials]

    [OPEN: date]

    [OPEN: real customer quote about Indicator Club, with the customer’s consent]

  • [OPEN: name or initials]

    [OPEN: date]

    [OPEN: real customer quote about Indicator Club, with the customer’s consent]

  • [OPEN: name or initials]

    [OPEN: date]

    [OPEN: real customer quote about Indicator Club, with the customer’s consent]

06 · PRICING

Individual indicators or the complete bundle?

Indicator Club is currently available as a bundle through a one-time purchase. Individual indicators can also be bought separately. Three- and six-month license options are planned.

3 MONTHS

Coming soon
[OPEN: 3-month price]3 months, coming soon

Planned features

  • Access to the Indicator Club bundle
  • Seven specialized indicators
  • Volume, momentum and volatility analysis
  • Chart analysis and scanner use
  • [OPEN: updates and support]
License term
3 months
Availability
Not yet available for purchase
Renewal
[OPEN: renewal terms]

Not yet available.

Coming soon

6 MONTHS

Coming soon
[OPEN: 6-month price]6 months, coming soon

Planned features

  • Access to the Indicator Club bundle
  • Seven specialized indicators
  • Volume, momentum and volatility analysis
  • Chart analysis and scanner use
  • [OPEN: updates and support]
License term
6 months
Availability
Not yet available for purchase
Renewal
[OPEN: renewal terms]

Not yet available.

Coming soon

ONE-TIME PURCHASE

€299including VAT, one-time payment

Included

  • All 7 Indicator Club indicators
  • Dollar Volume, Volume Buzz and ADR Percentage
  • Sigma Spikes and MACD Colored
  • VIX Volatility Zones and Fractals
  • Documentation and webinars
  • Updates, community access and support
Payment
One-time
Total price
€299 including VAT
License rights
[OPEN: exact license terms]

Three- and six-month options are not yet available for purchase. Prices, terms and the final scope of each option will be announced before launch.

The €299 total including VAT reflects the Digistore24 bundle price at the time of review. The current checkout price is binding.

According to the product page, all seven indicators are also available individually. Prices and purchase options are listed in the product overview: Browse individual indicators.

07 · FREQUENTLY ASKED QUESTIONS

Frequently asked questions

What is included in Indicator Club?

The bundle includes seven indicators: Dollar Volume, Volume Buzz, ADR Percentage Plot, Sigma Spikes, MACD Colored, VIX Volatility Zones and Fractals.

Do I have to use all seven indicators at once?

No. You can choose individual indicators for a specific purpose or combine relevant information about volume, momentum, volatility and price structure.

Can I buy the indicators individually?

Yes. According to the current product page, all seven indicators are available both as a bundle and individually. See the product overview for the purchase options.

Can I use these indicators in the scanner?

The product page confirms that indicator outputs can be used in the scanner and custom strategies. Available outputs and settings vary by indicator.

Is ADR Percentage included in the ADR AddOn?

Yes. According to the product page, ADR Percentage Plot has been part of the ADR AddOn since version 1.5. This is particularly relevant if you are considering buying that indicator separately.

Are documentation, support and a community included?

Yes. The product page lists documentation, webinars, software updates, support and access to the TrendFinder community. Personal coaching is available as an additional service.

Can I try Indicator Club before buying?

You can request a free trial through the ThinkAndTrade website. The trial offer provides the applicable terms.

Which purchase options are available?

The full bundle and individual indicators are currently available as one-time purchases. Three- and six-month licenses are planned but cannot yet be purchased.

More market context. Without changing your trading strategy.

Choose the seven-indicator bundle or try the tools without obligation.