FOR DAY TRADERS, SCALPERS AND MOMENTUM TRADERS USING AGENATRADER

Set stops based on market volatility. Not guesswork.

A fixed stop distance does not fit every market or every trading session. When you know an instrument’s typical daily range, you can put your stops and price targets into better context.

The Average Daily Range AddOn makes volatility visible on your charts, supports trend-following and countertrend signals, and includes an ADR-based trailing stop. Base your planning on measurable price ranges rather than rigid distances alone.

  • See daily volatility more clearly - with ADR bands directly on the chart
  • Evaluate trading setups more effectively - with trend-following and countertrend signals
  • Manage stops more systematically - with the ADR trailing stop-loss

For AgenaTrader · Currently available as a one-time purchase

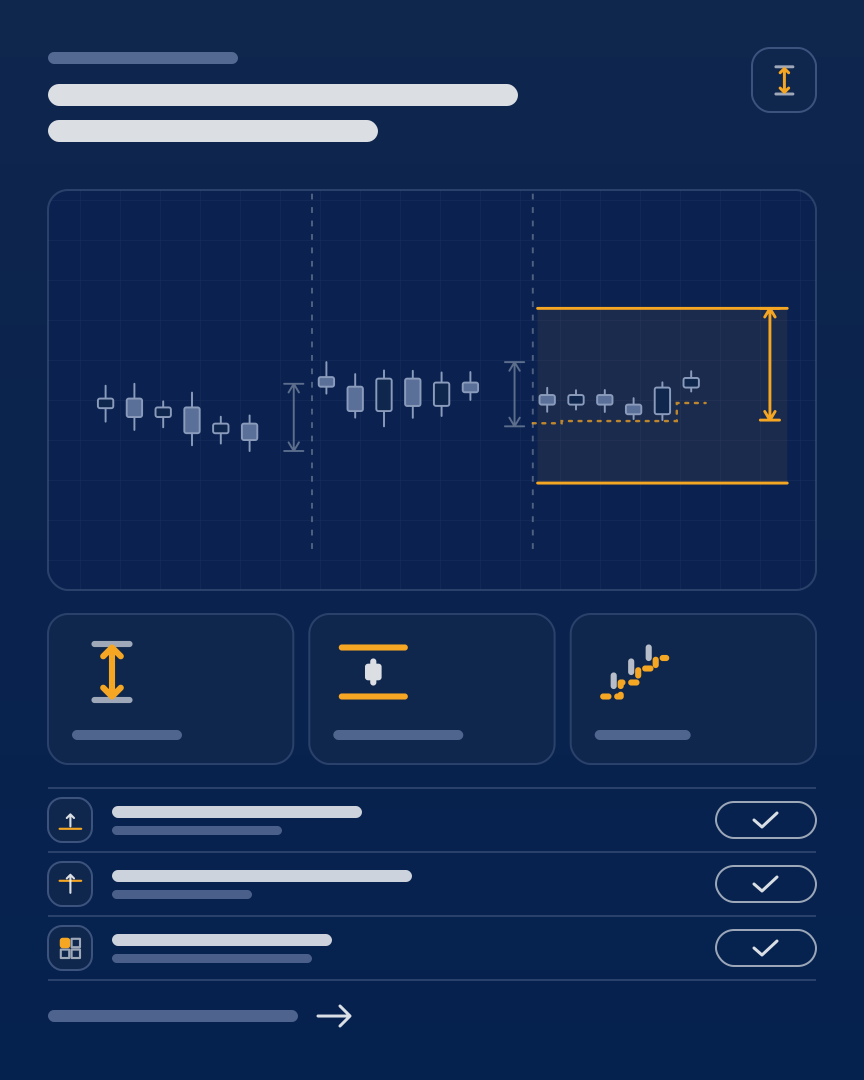
Average Daily Range as a measurement sheet: ADR channel on the chart, below it ADR, position in the channel and trailing stop
Dejan, founder of ThinkAndTrade

About me

DejanFounder of ThinkAndTrade and former AgenaTrader employee

I worked at AgenaTrader for five years and have developed indicators and trading tools for a range of trading approaches through ThinkAndTrade. Stop management in particular shows why it matters to put market movements in the right context.

That is what the ADR AddOn is designed for: making price ranges visible in AgenaTrader, providing signals for different setups and offering a matching trailing stop.

01 · THE CHALLENGE

Every market moves differently. Your stop should account for that.

A two-point move may be significant in one market and routine in another. Volatility also changes within the same market. Fixed stop distances and price targets do not automatically account for those differences.

The ADR AddOn adds volatility context to your charts. Assess typical daily movements, monitor signal zones and structure your stop management around your chosen ADR calculation.

COMMON CHALLENGES WITH STOPS AND TARGETS
  • Rigid stop distances: A fixed distance does not suit every instrument’s typical volatility.
  • Missing daily context: Without a reference, it is difficult to see how far a market has already moved.
  • Different trading setups: Momentum and countertrend trading require different types of analysis.
  • Repeated calculations: Volatility measures and stop levels need to be kept up to date.
02 · HOW IT WORKS

From daily volatility to a more structured trading plan.

The add-on combines an instrument’s average daily movement with signal monitoring and volatility-based stop management. Entry, risk and exit decisions remain yours.

  1. Step 1

    Select your instrument

    Open the instrument in AgenaTrader and choose the appropriate ADR calculation and settings.

  2. Step 2

    Put volatility in context

    View the average daily range and derived price zones directly on your chart.

  3. Step 3

    Monitor trading signals

    Use trend-following and countertrend signals as well as the provided scanner templates for your setups.

  4. Step 4

    Plan your stops

    Incorporate the ADR trailing stop-loss into your own stop-management rules and review position sizing and risk.

What does ADR mean?

Average Daily Range (ADR) measures an instrument’s typical daily trading range over a selected period. It helps put the current move into context relative to normal daily fluctuations.

03 · FEATURES

Six building blocks for your volatility-based workflow.

ADR is more than a value on your chart. The add-on combines range analysis, trading signals, trailing stops and ready-to-use AgenaTrader workspaces.

  • Feature 01

    Visualize ADR on the chart

    See the average daily range as a band and assess the current price movement in context.

  • Feature 02

    Choose your calculation method

    Select the approach that fits your analysis from the four calculation methods listed on the product page.

  • Feature 03

    Monitor trend-following signals

    Evaluate momentum setups, such as price breaking above the upper volatility zone on high volume.

  • Feature 04

    Monitor countertrend setups

    Consider pullbacks toward the lower ADR channel when evaluating possible counter-moves.

  • Feature 05

    Use an ADR trailing stop

    An ADR-based stop-loss trails price step by step along the selected timeframe.

  • Feature 06

    Use scanners and templates

    Work with signal scanner templates and prepared single-chart and list-chart workspaces.

04 · GOOD TO KNOW

Volatility helps you plan. It cannot prevent losses.

The ADR AddOn provides analysis and stop-management tools. A volatility-based approach can add structure to your planning, but it does not replace your risk rules or judgment in current market conditions.

Average ranges are not fixed price boundaries

A market can move substantially more or less than its average daily range. ADR bands are reference zones, not guaranteed support or resistance levels.

Trailing stops cannot guarantee an execution price

Even a trailing ADR stop may execute at a different price than planned during fast moves or price gaps.

Signals do not replace your judgment

Trend-following and countertrend signals help monitor possible setups. Whether you trade depends on your market assessment, strategy and risk limits.

Calculation methods affect the levels

The product page lists four calculation methods. Displayed levels depend on the selected method, lookback period and market data.

AgenaTrader and suitable market data are required

The add-on is designed for AgenaTrader. Charts and scanner results require appropriate market and chart data.

Coaching is an additional service

Documentation, webinars, community access and support are part of the published offering. Personal coaching is available separately.

05 · CUSTOMER FEEDBACK

What traders say about the ADR AddOn.

  • [OPEN: name or initials]

    [OPEN: date]

    [OPEN: real customer quote about the ADR AddOn, with the customer’s consent]

  • [OPEN: name or initials]

    [OPEN: date]

    [OPEN: real customer quote about the ADR AddOn, with the customer’s consent]

  • [OPEN: name or initials]

    [OPEN: date]

    [OPEN: real customer quote about the ADR AddOn, with the customer’s consent]

  • [OPEN: name or initials]

    [OPEN: date]

    [OPEN: real customer quote about the ADR AddOn, with the customer’s consent]

06 · PRICING

Choose your ADR AddOn license.

The ADR AddOn is currently available as a one-time purchase. Additional three- and six-month license options are planned. Purchases and payments are processed through Digistore24.

3 MONTHS

Coming soon
[OPEN: 3-month price]3 months, coming soon

Planned features

  • ADR AddOn for the selected term
  • Volatility bands and ADR values
  • Trend-following and countertrend signals
  • ADR trailing stop-loss
  • [OPEN: updates and support]
License term
3 months
Availability
Not yet available for purchase
Renewal
[OPEN: renewal terms]

Not yet available.

Coming soon

6 MONTHS

Coming soon
[OPEN: 6-month price]6 months, coming soon

Planned features

  • ADR AddOn for the selected term
  • Volatility bands and ADR values
  • Trend-following and countertrend signals
  • ADR trailing stop-loss
  • [OPEN: updates and support]
License term
6 months
Availability
Not yet available for purchase
Renewal
[OPEN: renewal terms]

Not yet available.

Coming soon

ONE-TIME PURCHASE

€499including VAT, one-time payment

Included

  • Average Daily Range AddOn for AgenaTrader
  • ADR bands and four calculation methods
  • Trend-following and countertrend signals
  • ADR trailing stop-loss
  • Scanner and chart templates
  • Documentation, updates and webinars
  • Support and community access
Payment
One-time
Total price
€499 including VAT
License rights
[OPEN: exact license terms]

Additional three- and six-month license options are planned but cannot yet be purchased. Prices and license terms will be published when they launch.

The €499 price including VAT reflects the Digistore24 total shown for the one-time purchase at the time of review. The current checkout price remains binding.

You can request a free trial here: Try the ADR AddOn free.

07 · FREQUENTLY ASKED QUESTIONS

Frequently asked questions

Who is the ADR AddOn designed for?

Day traders, scalpers and momentum or swing traders who want to use typical daily ranges as context for their setups and stop planning.

What does Average Daily Range mean?

ADR is the average difference between the daily high and low over a selected period. It helps compare the current move with normal daily fluctuations.

Which trading signals does the add-on provide?

The product page confirms trend-following and countertrend signals, including momentum setups near the upper ADR channel and possible counter-moves after pullbacks toward the lower zone.

How does the ADR trailing stop-loss work?

The included trailing stop is based on the average price range and can be moved in steps during the selected timeframe. It cannot guarantee execution at a particular price or limit every loss.

Can I use the add-on in the scanner?

Yes. The product page lists signal scanner templates and several prepared chart workspaces. Results depend on data, calculation method and settings.

Which calculation methods are included?

The current product page lists four ADR calculation methods. The included documentation explains the available choices and how they differ.

Can I try the ADR AddOn before buying?

Yes. Request a free trial through the ThinkAndTrade website. The trial offer contains the applicable conditions.

Which purchase options are available?

A one-time purchase is currently available. Three- and six-month license options are planned but cannot yet be purchased. Current prices are shown at the official checkout.

Less guesswork with stops. More volatility context.

See typical daily ranges, monitor signals and try the add-on for yourself.